1The problem: we know they kill, we don't know which one to fix first

Distribution power lines electrocute the birds that perch on their pylons; conductors and turbine blades strike them in flight. These are the leading causes of non-natural mortality among large raptors and soaring birds in Spain.

Electrocution

Distribution pylons (1-66 kV)

The bird perches on the cross-arm and touches two phases, or a phase and earth. It depends on the pylon design, the type of insulator and whether there are taps or disconnectors. It affects vultures, eagles, storks, kites and Eurasian eagle-owl.

Collision with conductors

Any line, above all the earth wire

Birds with poor manoeuvrability or flying in flocks, at dawn and dusk: common cranes, storks, Eurasian spoonbills, grey herons, great bustards. Worse on hillsides, passes and flyways.

Collision with wind turbines

Blades on ridges and passes

Soaring birds that use the very updraughts that justify the wind farm: griffon vulture, Egyptian vulture, bearded vulture, golden eagle, kites.

What is missing

Spanish Royal Decree 1432/2008 requires dangerous lines inside protection zones to be retrofitted, and there is excellent academic work on specific sites and years. But there is no up-to-date, queryable service that tells a utility, a public authority or an NGO which specific elements to review first, in which month and for which species. Retrofitting is decided from old inventories, from mortality someone happened to come across, or segment by segment once a complaint arrives.

2The idea: risk = exposure × presence × sensitivity

A pylon is dangerous if there are many dangerous pylons at that spot, if sensitive birds are there, and if it is the time of year when they use it. Each of those factors can be estimated from open data and updated automatically.

OpenStreetMap lines · pylons · wind turbines GBIF + eBird records by species and month · effort Movebank published GPS tracking Terrain (30 m) slope · ridges and passes Exposure per cell km of line · pylons × hazard · turbines Presence by species and month records / effort, smoothed, + GPS Topographic factors + collision on slopes and ridges Sensitivity by species literature weights + legal status Risk index cell × species × month 3 mechanisms Monthly map Pylon ranking GeoTIFF · CSV Score projects (consultations)

The index is relative to the region (the 99th percentile equals 100): it ranks, it does not certify mortality. A pylon with an index of 300 does not kill three times more than one with 100; it simply brings together more pylons, more sensitive birds and more months of presence than 99% of the grid cells.

3Data used: all open, none behind a key

The design condition was that anyone could run the project without asking for permission. That holds; the only layer that requires a key (eBird Status & Trends) is ready but not yet loaded.

SourceWhat it providesVolume in the pilotsLicence
OpenStreetMap (Overpass)Lines with voltage and operator, pylons and poles with their tags (material, insulator, taps), wind turbines Cantabria: 46,300 pylons, 4,535 segments, 463 turbines
Strait: 2,703 pylons, 414 segments, 516 turbines
ODbL
GBIF, which integrates the eBird Observation DatasetGeoreferenced records by species, month and year since 2010. Records of all birds measure observation effort Cantabria: 1.35 M bird records (effort), 101,000 of 18 species
Strait: 165,000 records of 16 species
CC0 / CC BY / CC BY-NC depending on the dataset
Movebank Data RepositoryGPS tracks published alongside the scientific papers: where tagged individuals actually fly Strait: 296,719 positions of black kite, 64,567 of white stork
Cantabria: 5 positions (no published datasets for the area)
CC0
AWS Terrain Tiles (terrarium)Elevation at 30 m → slope and topographic position index (ridges and passes)Both regions in fullPublic domain
LiteratureSensitivity weights by species and mechanism (Bevanger 1998, Janss 2000, Lehman 2007, Marques 2014) and status in the Spanish Catalogue of Threatened Species21 species—

Species assessed

Strait: griffon vulture, cinereous vulture, Egyptian vulture, Spanish imperial eagle, Bonelli's eagle, golden eagle, short-toed snake eagle, booted eagle, European honey buzzard, black kite and red kite, peregrine falcon, white stork and black stork, common crane and Eurasian eagle-owl. Cantabria swaps the Mediterranean species for bearded vulture, red-billed chough, Eurasian spoonbill and grey heron. Each species carries a weight per mechanism (0-1) and a conservation weight, both adjustable in a single configuration file.

4Results so far

Two pilots with opposite profiles: the Strait, with few pylons but a migration bottleneck and a great deal of GPS data; Cantabria, with 46,000 pylons, no GPS and a mountain avifauna.

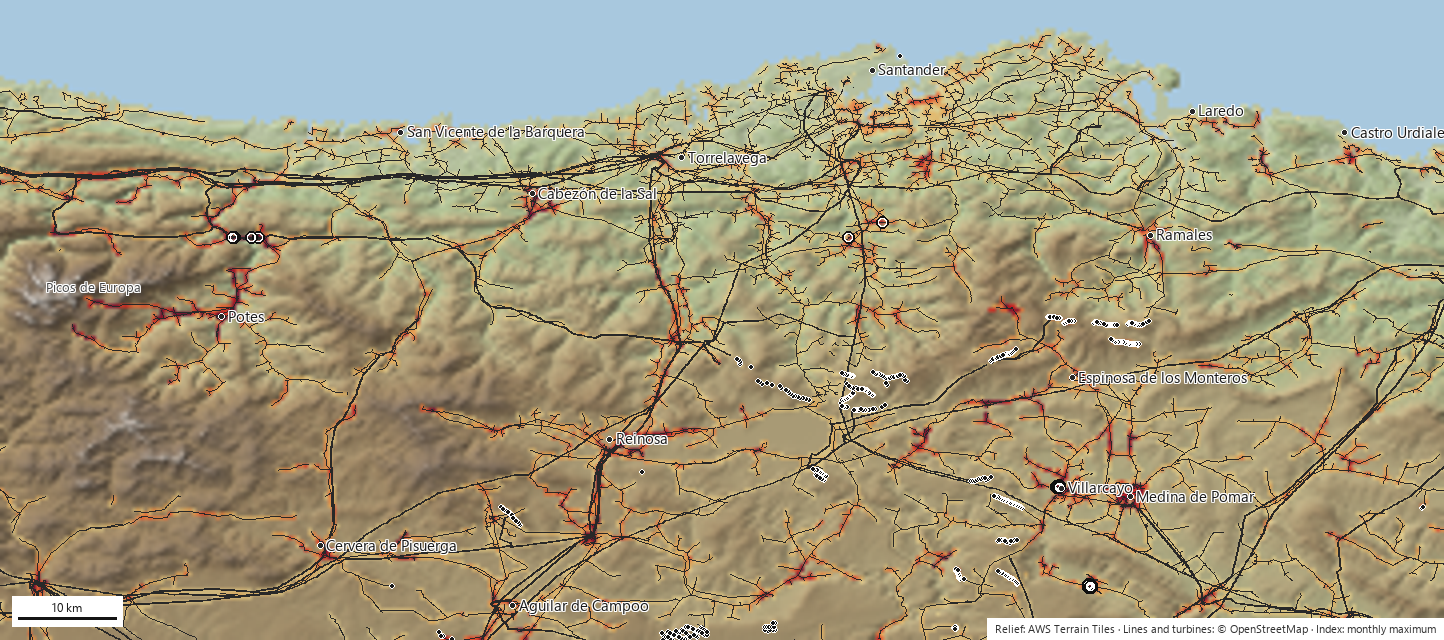
Annual risk index in Cantabria: cells coloured from yellow to dark red over a shaded relief map with the power lines in grey
annual index (monthly maximum), from low to high; the background is shaded relief (green lowland, brown mountain, blue sea) OSM power lines (thick: transmission) wind turbines top 40 in the ranking
Cantabria and its surroundings (42.75-43.55° N · 4.90-3.10° W). The highest-index pylons are in the south of the frame, in Las Merindades (Burgos), in February, with white stork, wintering red kite and griffon vulture. The riskiest line segments are 12 kV and 30 kV lines on the floor of the Liébana valley, in July, beneath the passage of booted eagles, European honey buzzards and short-toed snake eagles. Wind turbines peak in November on the eastern moorlands (red kite, griffon vulture, golden eagle). The Campoo wind farms fall in cells with an index three times the 99th percentile.
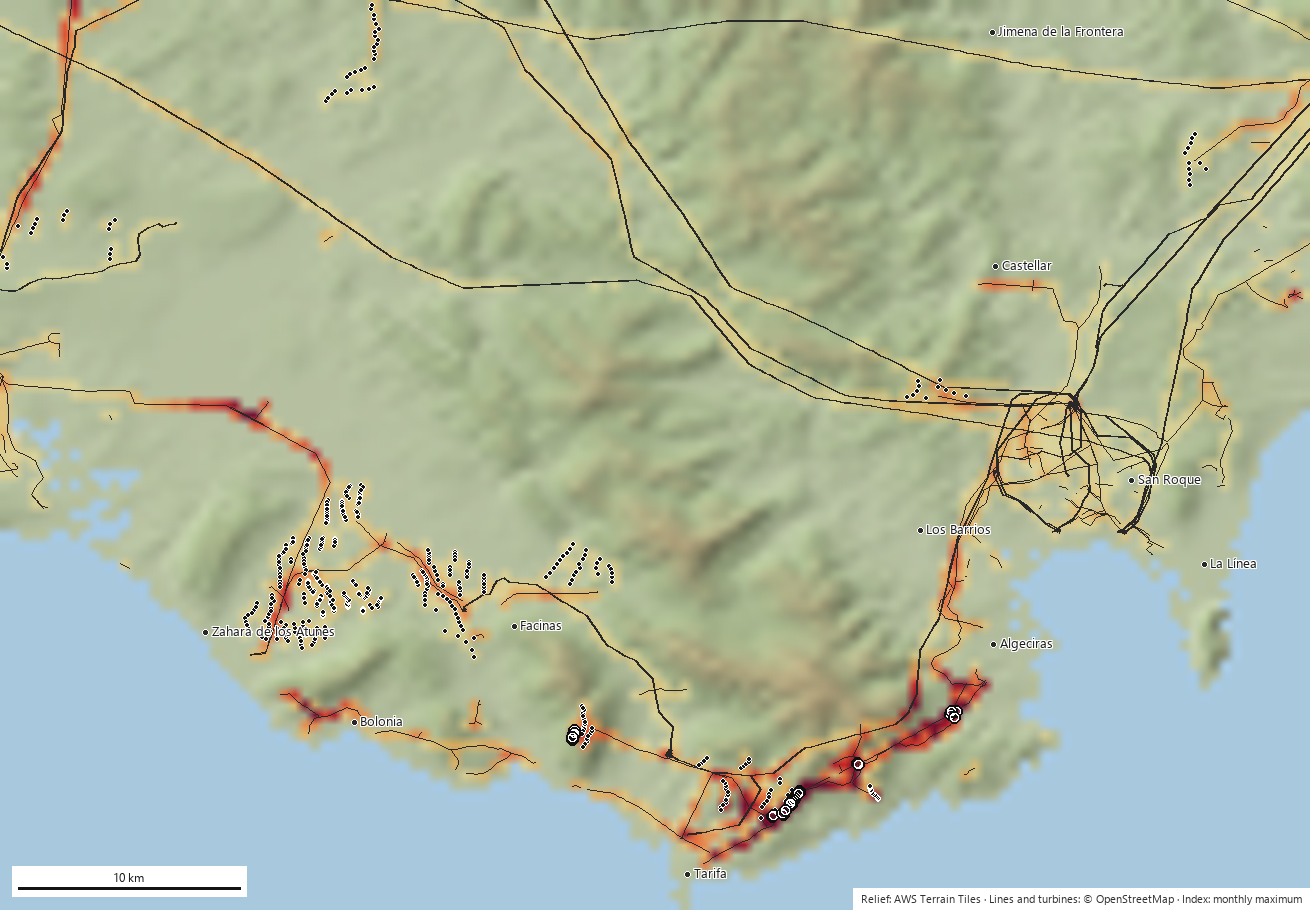
Annual risk index in the Strait of Gibraltar over a shaded relief map
Strait of Gibraltar (36.00-36.45° N · 5.95-5.30° W). The 300,000 GPS positions of black kite reinforce the sierras east of Tarifa, where the wind farms are concentrated. The riskiest distribution pylons are in that same strip (El Cuartón-Pelayo) in October and November, with cinereous vulture, red kite and Bonelli's eagle; lines and wind turbines peak in September and October, at the height of the post-breeding migration.
Model output

Clear seasonality

Cantabrian pylons peak in February (wintering red kites and arriving storks); the Liébana lines in July; the wind turbines of the Strait during the autumn passage. Retrofitting in the month before the peak is what matters to a utility.

Model output

Projects scored

The same raster scores any polygon in seconds. Applied to the notices from the public consultation observatory, the Somaloma-Las Quemadas wind farm (Campoo) reaches a maximum of 329, peaking in September.

Not yet

No validation against real mortality

The ranking is consistent with what is known about each area, but nobody has gone out to check whether there are carcasses under the top 40 pylons. That is the first action we are asking for (section 6).

5Challenges and problems encountered

Each one changed the code. We set them out because they are the same ones anyone will meet who wants to reproduce or extend the work.

6What would improve accuracy, in order

The model already ranks; what is missing is to calibrate it against reality and refine the two weakest layers: the actual presence of birds in rarely visited cells and the actual condition of each pylon.

PriorityActionWhat it fixesWho can help
1Field-check the top 40 pylons in each region: photograph the design, search for carcasses under the pylon, RD 1432/2008 form.Validates the ranking and gives the first mortality points for calibration. One weekend of volunteering per region.Local NGO groups; environmental rangers.
1Existing mortality records: power line inventories from the regional governments, wildlife rescue centres (cause of admission and coordinates), utility data and LIFE projects. Replaces the literature weights with weights estimated by regression on real cases. Public authorities and rescue centres, with the NGO as counterpart.
1eBird Status & Trends as the main abundance layer (weekly, 3 km, modelled with effort).Removes much of the observer bias and fills in the cells with no records. The loader is already written; what is missing is the key, which is being processed.Cornell Lab (free research key).
2Acoustic stations with BirdNET on wind turbines, on the pylons at the top of the ranking and in rarely visited areas. A microphone plus a single-board computer (BirdNET-Pi or BirdWeather) that identifies songs and calls continuously and publishes the detections; these can be uploaded to eBird as checklists. Presence 24 hours a day, 365 days a year, without depending on an observer passing by: exact date and time of use of each site. It works very well for choughs, cranes, storks, eagle-owls, jackdaws and passerines; poorly for vultures and eagles, which barely vocalise. Hence it is combined with the next item. NGOs and wind farm developers (the farms already have power and a network at each turbine).
2Cameras and radar at the wind farms: the detection systems already fitted to many wind turbines (selective shutdown) record species, height and trajectory. Flight height, the variable that no record provides; and ground truth for collision with blades. Developers; the authorities can require the records to be handed over in the environmental decision.
2Pylon design data from the utilities: type of cross-arm, insulator, jumpers, disconnectors on each pylon.Real hazard ratings instead of the default 1.0 applied to 89% of the pylons. Distribution companies (Viesgo/EDP, Endesa, i-DE), required to keep inventories under RD 1432/2008.
2GPS from the local populations: bearded vultures, Egyptian vultures and the vultures of the Cantabrian range already carry transmitters from conservation programmes.The layer that improved the Strait most does not exist in Cantabria. An agreement on aggregated use (individual-days per cell) is enough, with no need to hand over tracks. Fundación para la Conservación del Quebrantahuesos, GREFA, regional authorities.
3Targeted citizen science: the effort map itself flags the cells with power lines and no records; ask observers to visit them.Fills the gaps at zero cost.NGO members, local eBird groups.
3Validation in the Basque Country: a new region and comparison with the Basque Government's official shapefile of dangerous line segments.A first independent check at no cost.Us.
3PNOA LiDAR terrain (2-5 m) and wind variables. Better detection of passes and ascent slopes; seasonality of thermals.IGN (open data).

On the microphones: automatic song identification is done not by eBird but by BirdNET, from the same laboratory (Cornell Lab of Ornithology). A station costs around €100-150 in components, draws 5 W and detects at some 100-300 m depending on species and noise; on a wind turbine the microphone has to be kept away from the nacelle because of blade noise. It provides presence and phenology with hourly precision, not flight height or collisions: it complements the cameras, it does not replace them.

7What we ask for and what we offer

We ask for

An institutional counterpart to request mortality records and pylon design data from public authorities and utilities; local groups for the field check of the top pylons in the ranking; agreements on the aggregated use of GPS data; and a pilot area in which to install the first acoustic stations.

We offer

Open, documented code with no licence costs; maps and rankings updated every month; new regions in hours (all we need is the bounding box); automatic scoring of the wind farm and power line projects that go out to public consultation, ready for consultation submissions; and GeoTIFF and CSV files that open in QGIS.

Status and next steps

A working prototype (version 0.1, September 2026) with two regions, an automated monthly process and a public website. In progress: the eBird Status & Trends key. Next: field checks of the top pylons and a validation region in the Basque Country.

How it is computed

Everything happens on a grid of 0.005° cells (about 450 × 550 m). For each species s, month m and cell, three indices are computed:

electrocution[s,m] = P[s,m] · w_electro[s] · equivalent_pylons            (pylons ≤ 66 kV only)
line_collision[s,m] = P[s,m] · w_col_lin[s] · km_of_line · (1 + terrain)
turbine_collision[s,m] = P[s,m] · w_col_aer[s] · n_wind_turbines · (1 + ridge)
  1. Download the infrastructure from OpenStreetMapLines classified by voltage: up to 66 kV is distribution (electrocution risk, the scope of RD 1432/2008); above that, collision only. Pylons inherit the voltage of their line. Where no pylons are mapped, 6 per km of distribution line are assumed.
  2. Hazard rating of each pylonA factor of 0.5-2 from the OSM tags: wood 0.5; pin insulator 1.5; strain insulator 1.3; taps, sectioning points and line terminations 1.3; horizontal cross-arms 1.1; portal frames 1.3. With no tags, 1.0. Capped at 20 pylons per cell (more than that is a substation, not a power line).
  3. Monthly presence P by speciesDensity of records of the species divided by the density of records of all birds in the same month (this corrects for the fact that people observe more near roads and viewpoints). Adaptive Gaussian smoothing: 1.5 km with 300 records or more in the month, wider with fewer. Records repeated at the same point, month and year count as √n. Normalised to 0-1 per species.
  4. GPS tracking where it existsIndividual-days per cell and month from the Movebank tracks, blended into P with a weight that grows with the number of positions (up to 50% from 2,000 positions). Five fixes from a passing bird do not move the map; 300,000 do.
  5. TerrainSlope (up to doubling the risk of collision with lines above 25°) and topographic position index at 1.5 km (ridges and passes, where soaring birds cross low and where wind farms are built).
  6. Aggregation and confidenceEach species adds to the total index with a weight of status × confidence, where confidence is min(1, records/500) or grows with the GPS positions: a species with 120 records in the region (common crane in Cantabria) keeps its own layer but does not dominate the ranking.
  7. Scaling and rankingEach index is rescaled so that the region's 99th percentile equals 100, without clipping the maxima. Each pylon takes the electrocution index of its cell multiplied by its hazard rating; each segment, the mean along its route; each wind turbine, that of its cell. The peak month and the three species contributing most are stored.
  8. Publish and repeatInteractive map with layers by month, mechanism and species; report; CSV and GeoJSON of the ranking; 12-band GeoTIFF for QGIS. An automated process recomputes everything on the 2nd of each month with the new records.

Parameters

Grid cell0.005°
Maximum distribution voltage66 kV
Pylons assumed where none are mapped6 per km
Pylon cap per cell20
Record smoothing (σ)1,500 m with ≥300 records in the month
GBIF recordsfrom 2010, up to 20,000 per species
Minimum records to include a species30
Full confidence500 records or 2,000 GPS fixes
Maximum GPS weight (Movebank)50%
eBird Status & Trends weight70%
Slope at which line collision doubles25°
Topographic position radius1,500 m
Scale99th percentile = 100

Validation

Pending. The ranking has not yet been checked against real mortality: there is no open dataset of electrocuted or collided birds in Spain. The first planned check is against the Basque Government's shapefile of hazardous power lines (region euskadi); once mortality points are available, the species weights will be fitted with a logistic regression.

Limits